Forecasting flash floods with LSTM, ARIMA and Prophet using time series data from hydrological sensors monitoring French rivers.
Predicting propagation of floods in time to save lives
Flash floods have been the major cause of disasters for years, costing lives and taking away people's homes and livelihoods. The climate change fuelled extreme events of the last 2 years just gave us a sneak peak on how early warning systems might become one of the most critical applications in every corner of the planet.
The AI for Earth engineers tackled the unpredictability of flash floods in the AI for Earth - Inland Floods Prediction Challenge. The goal was to accurately predict a river flood event from water level data measured upstream. It would serve as input for early warning systems and help mitigate the impact of floods across a river’s course.
Water level data from hydrological sensors
The data the machine learning models were to be trained and tested with was taken from a network of hydrological stations monitoring river estuaries in France. We used data from two different data sources:
The data from sensors installed by Vortex.io - a real-time hydrological data service building prediction systems. Despite having a variety of data from the monitoring available, for example the weather, the wind, etc., we’ve decided to focus on time series data of water levels (river height) with a timeframe of approximately 5 minutes.
The data required different preprocessing steps. Data with water height only had to be extracted from the measurements. The two sources varied in formats and the height was in different scales. We homogenized the data, implemented name conventions and metrics (turning water level metric into meters) and changed the data point frequency of the time series to every 1 hour to be data-source independent.
A significant amount of measurements was missing in both datasets (NaN). Sensor stations which had more than 20% missing data were omitted. For the rest, we imputed missing values using interpolation.
The battle of 3 models for greater prediction accuracy
Following data processing and analysis the teams started testing the different types of models best suited for the flood prediction use case.
Accuracy was the most important parameter of the final model. When a model predicts a flood event, a warning system is triggered to notify people to evacuate the area. You don’t want the people to be falsely notified to evacuate, nor not to be warned of an upcoming flood. We had to balance the model accuracy with how many hours ahead the prediction will be. You’d want to give people enough time to see the warning and evacuate the area.
The model had to fulfil certain requirements:
Regressive forecast
Multivariate
Handle seasonality
This yielded several options for experimentation:
ARIMA (Autoregressive Integrated Moving Average) - a classic linear framework for time series prediction
Prophet - traditional additive regression model with a piecewise linear or logistic growth curve trend
LSTMs (Long Short-Term Memory) - a powerful recurrent neural network
We’ve split the group in 2 teams to work in parallel to come up with several possible avenues of usable prediction models and test assumptions on real life data.
Since the main goal of the project was to accurately predict floods (and to a lesser extent droughts), we considered it more important to inspect if they were accurately predicted. We wanted an as accurate as possible prediction for a window within 24 hours.
TEAM 1: Linear vs. Deep Learning prediction models
Our Inland Floods Prediction Team 1 split into three parts to experiment with all of the 3 models. To compare models’ results, we used the same training and test sets from 2 stations. We selected datasets that included flood events.
The following metrics were used to evaluate the models:
Root Mean Squared Error (RMSE)
Mean Absolute Error (MAE)
Mean Absolute Percentage Error (MAPE)
Correlation (Corr)
Data from the Marmande station
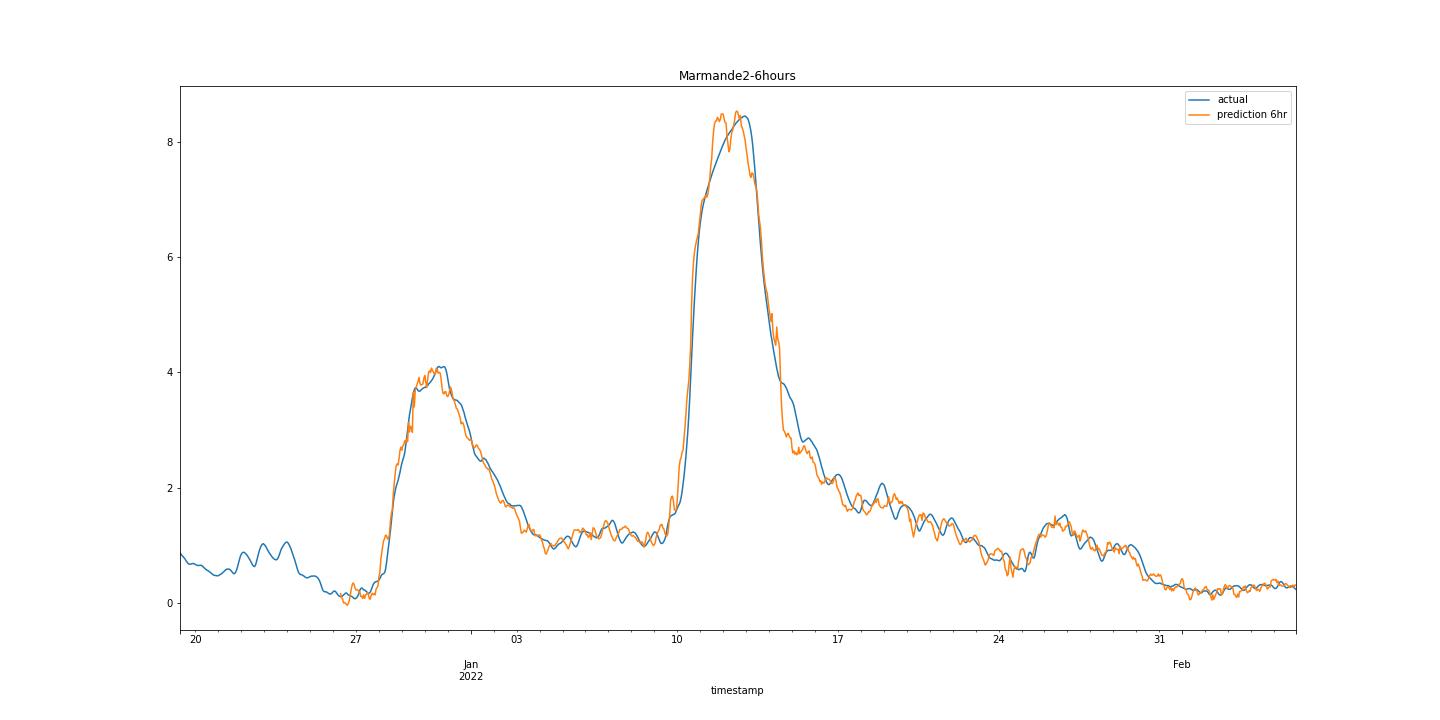
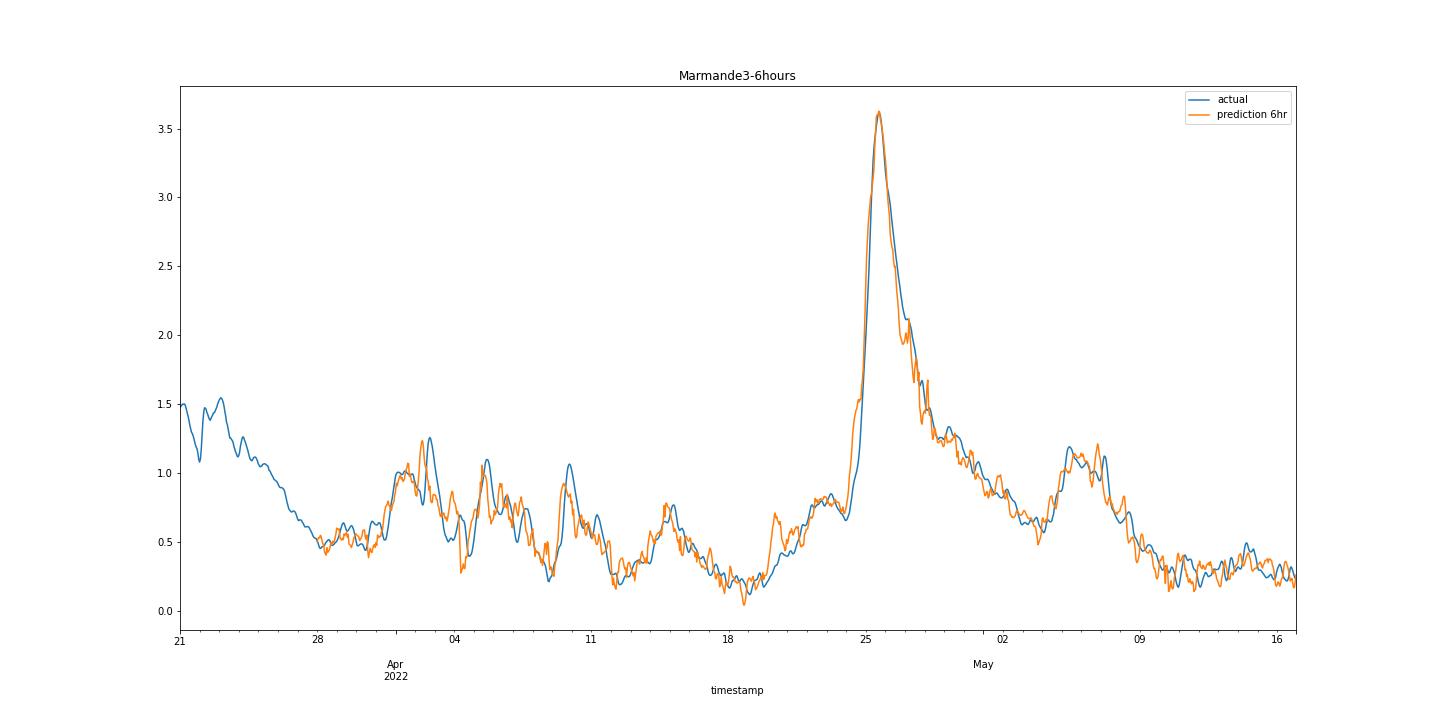
Below are the 3 test set 6-hour ahead predictions for the ‘Marmande’. To plot these predictions, we used a week of data to predict the next 6 hours, and then we did that iteratively until the whole test set was predicted.
ARIMA predictions
LSTM predictions
Prophet predictions
The ARIMA model managed to outperform the other two in all the evaluation metrics, achieving an average Mean Absolute Error of less than 9 centimeters.Even though its long-term capabilities were quite limited within the prediction timeframe of 6 hours, it produced the best results in the team's experimentation.
“This was a surprising moment for us. The recurrent neural network LSTM was expected to do a better job at time series prediction. It’s a novel; way more complex algorithm. Moreover, both deep learning models were multivariate meaning they are also using the water level data of all the stations upstream of the forecasted station. This was the biggest take away for us - that a newer, more advanced neural network fed with a lot of data can still be outperformed by a linear univariate forecasting model like ARIMA.” - Georgios Gkenios, AI for Earth engineer
ARIMA fine tuned and repeatable forecast pipeline created
We went on to further fine-tune the ARIMA model. We tweaked the code of its predictive model, achieving accurate predictions within a 10cm range on average, up to 6 hours in advance, and scoring an error margin of less than 10%.
With one week of the Challenge left, we decided to focus on model feasibility in real life - ease of deployment and on scalability. We wanted to create a defined and clear sequence of steps that starts with the data and ends with the forecast. From homogenizing the data, imputing missing values, fixing the time series data points, loading the model to making the prediction.
We delivered the blueprint of an ARIMA-based model that can predict with high accuracy the likelihood of flash floods in the short term (within 6 hours). The predictive model has the potential to deliver valuable short term predictions, especially for populations in small towns that lack the necessary alarm infrastructure. It can be easily generalized to other rivers, as it only uses data from hydrological sensors measuring water levels and does not require other data sources (e.g. weather forecasts, satellite imagery or hydrological data).
TEAM 2: Getting Prophet to do its magic for long-term forecasts
After a short stint playing with both, LTSMs and Prophet, our Inland Floods Prediction Team 2 settled on the latter which performed better. We decided to squeeze the best results out of the Prophet algorithm.
Below, you can see the results for two sensor stations:
Marmande, where significant floods occurred
Cadillac, which is close enough to the coast that tidal effects came into play
We tested multiple prediction lengths (e.g. 2h, 8h and 24h). In the final analysis we focused on 24 hour prediction, since this is where team 1's performance degraded, but Prophet still got reasonable results.
We experimented with 3 approaches:
UV - univariate; forecast in the future using only the measurements you’ve obtained at the present sensor station
MV - multivariate; forecast in the future using also data from upstream sensor stations
MV+ - rolling forecast, multivariate; forecast using upstream sensor data; the model is retrained after every forecast, using the new bit of information.
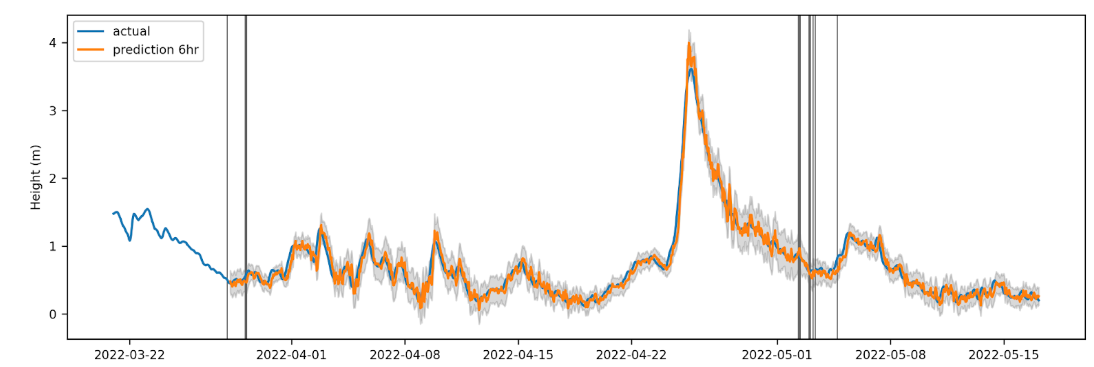
The multivariate rolling forecast outperformed all others. It traced the actual measurements very well. However, at flooding events, it lagged the actual measurements by a couple hours.
Forecast on the Marmande station test data
Forecast on the Cadillac station test data
MV+ and MV are close. The model is able to recognise the seasonalities in the measurements, however, performance is worse than in Marmande (more deviations).
The multivariate rolling forecast was best at 24hr advance predictions
The multivariate model gives great forecasts. At the Marmande dataset, performance could be improved by including more events, which is a feature of the Prophet model. An example event would be, if the water has risen 1m within a given timeframe, then the event is triggered. This could improve performance at flooding events.
At Cadillac, the sensor station close to the coast, performance could be improved by fine tuning the seasonality measurements. Seasonality in this case means the influence of tides and ebbs on floods of the exposed river estuaries. The expert knowledge of including these seasonalities in the model would make it easier for the model to make accurate predictions.
“Prophet MV+ model excelled when forecasting 24 hours in the future, even compared to the outcomes of Team 1. While ARIMA had comparable performance to Prophet at short-term (up to 6 hrs) it didn’t keep up with its accuracy for the 24 hour time span.” - Flin Verdaasdonk, AI for Earth engineer
For further follow-up steps we’d suggest to tweak the Prophet method by
Provide more thorough quantitative analysis; include evaluation metrics
Add models that are trained to reduce the residual error
Find events which improve flooding predictions
Inspect if coastal predictions can be improved using additional seasonalities
It would be also interesting to experiment with forecasts (with any model) by including weather data and satellite image analysis.
Managing teams through vacation season
The AI for Good Challenges require a lot of coordination and mentorship so participants don’t disconnect from the project, with the weekly meetings, hurdle analysis and progress reports. Vacation season proved to be challenging, losing engineer capacity of several weeks to reducing entire teams.
But for us who stayed to the end, the Challenge felt like building a new, small data team within a startup. We had to set roles, methodologies, communication strategies; and work as a completely autonomous team. This involved picking up responsibility, project managing, scripting and laughs. One shared emotion of our team was the gratitude for the purpose of this Challenge and for the FruitPunch AI team, who always gave us positive reinforcement and helped us understand the value of group collaboration.
Georgios Gkenios & Flin Verdaasdonk
AI for Earth II engineers
Inland Floods Prediction Team 1: Agustin Iniguez Rabago, Georgios Gkenios, Kiki van Rongen, Pavlos Skevofylax, Sabrina Wirjopawiro, Samantha Biegel
Inland Floods Prediction Team 2: Flin Verdaasdonk, Sabelo Mcebo Makhanya
Subscribe to our newsletter
Be the first to know when a new AI for Good challenge is launched. Keep up do date with the latest AI for Good news.
Thank you!
We’ve just sent you a confirmation email.
We know, this can be annoying, but we want to make sure we don’t spam anyone. Please, check out your inbox and confirm the link in the email.
Once confirmed, you’ll be ready to go!
Oops! Something went wrong while submitting the form.


.jpg)


.png)


.jpg)